In Task 1 of the IELTS Writing paper (1 hour), the examiner is looking for your ability to identify and describe – in academic style – the main features of some visual information: this may be a graph, table, chart or diagram of a device or process. You should give a well-organised response of at least 150 words and spend 20 minutes on this section of the exam (Task 2 is worth twice as much and should therefore take 40 minutes). Twenty minutes is not long at all, so you need to be as prepared as possible before you sit the exam.
Here at SGI we have plenty of experience preparing students for the important IELTS exam and understand how daunting an academic-style writing task can be for students; if you have only ever studied and experienced General English, there certainly is a lot to take in. The following tips have been compiled to help you through your preparation process:
- Summarise the Key Features
The ability to summarise various types of information is an important skill at university-level study. In Writing Task 1 you are expected to highlight the main features of a graph, diagram, chart or table, leaving out minor details and irrelevant information. This means that you will need to spend a couple of minutes at the start deciding which points you are going to include.
- Paraphrase
Wherever possible, put any useful terms or phrases that are given in the title or labels into your own words. Use synonyms, but also restructure your sentences so it does not seem that you have simply done a ‘copy-paste’ from the question sheet.
- Keep it Impersonal
Avoid sentences like:
I/We can see that…
I think it’s an interesting feature that…
Instead, use impersonal pronouns and structures such as the passive voice:
It can be seen that…
A striking feature of the graph is…
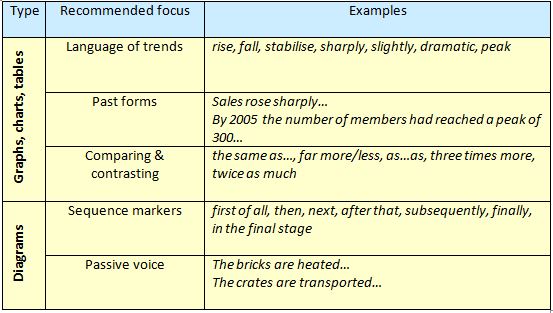
- Use Appropriate Language
First of all, you should not use any informal or slang words or expressions in the Writing exam – keep the vocabulary formal and academic. In addition, you will need to be confident using specific vocabulary and structures that will help you manage the task effectively:
- Make Sure What You Say is True (according to the given data)
Perhaps this sounds obvious but it’s not always easy in practice. Imagine, for example, a student is describing a graph that shows numbers of visitors to London and Paris over a ten-year period – is the following sentence correct?
Paris increased significantly between 1990 and 2000 while London dropped slightly in the same period.
You have probably realised that the student needs to be more careful with the subjects in this sentence: Paris itself did not grow, but the number of visitors did. The correct version goes something like this:
The number of tourists visiting Paris increased significantly between 1990 and 2000 while those going to London in the same period dropped slightly.
- Do Not Give Your Opinion
Perhaps, in the example graph mentioned above, you are absolutely certain that it is the quality of the food that drew more visitors to Paris than London; or maybe you are aware of some political or economic issues that may have impacted on tourism in both cities… However, you should not speculate or give opinions on the data – you are simply expected to describe the data given. No more.
In addition to these tips, the usual steps of the writing process should be followed – planning, writing, reviewing and editing. Make sure you have plenty of timed practice before the real exam.
S.S.L